Event Report – Main Page and Information Page
Detailed reporting on all Quick RFQ and E-Auction processes conducted in the system is available. Reports for all processes are maintained under the Process Report section.
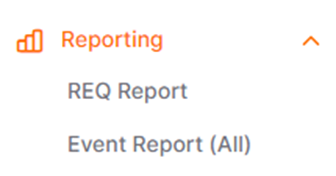
To access the Process Report, click on the "Event Report" menu under the "Reporting" heading on the left side of the screen.
On the opened page, graphical data related to all processes belonging to the recipient can be viewed. All data in the report is updated every 24 hours.

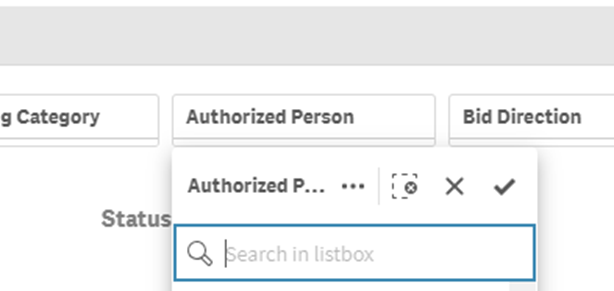
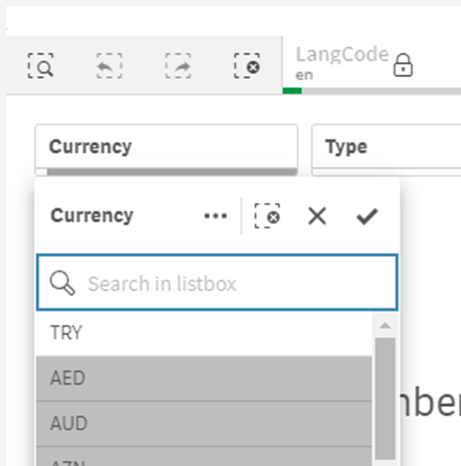
Filters located at the top of the screen allow filtering based on details such as year, month, purchase category, currency, and similar options. Graphs are automatically updated based on the selected filters.
Currency information in the reports automatically defaults to the company's primary currency. To change the report currency, click on the "Selections" heading located in the top right corner of the screen, and update the currency there.
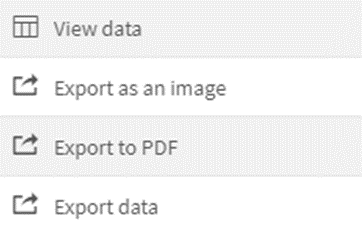
When you right-click on any graph, the following options are available in the menu:
View data: Accesses the raw data used to create the graphs.
Export as an image: Downloads the displayed graph as an image for visual use.
Export to PDF: Allows the graph to be downloaded in PDF format.
Export Data: Downloads either the displayed graph or the raw data as an Excel file.
Event Report Main Page Graphics
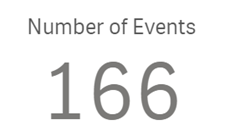
Number of Events: It shows the total number of Events.
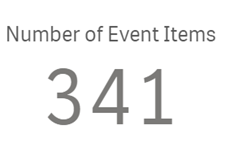
Number of Event Items: It shows the total number of items (entries) in Events.
Status Analysis: It shows the breakdown of Event processes by status in percentage terms.
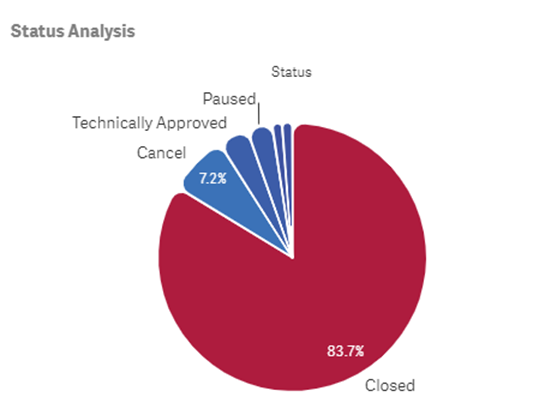
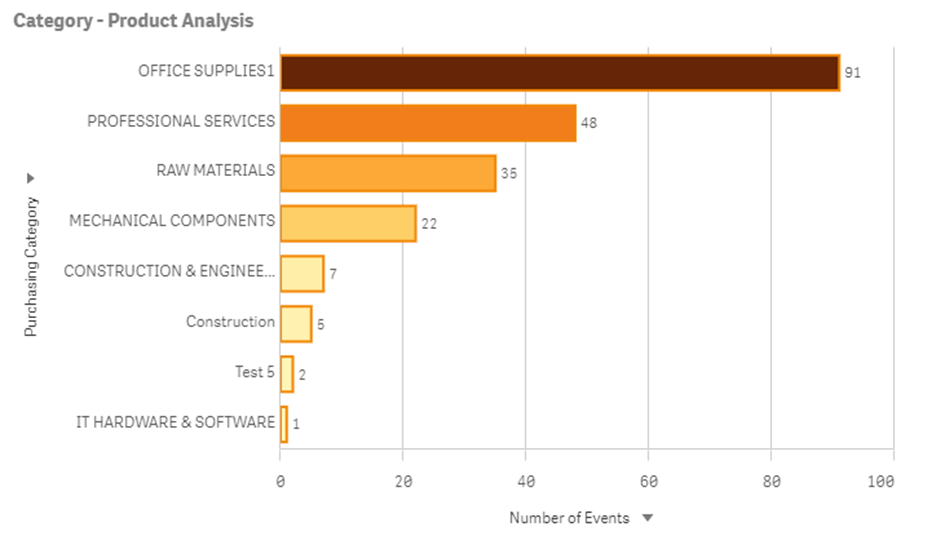
Category - Product Analysis:Displays the top purchase categories or products where Events have been created, based on the number of processes or the number of items (entries).
Category Analysis: This area defaults to showing the top purchase categories where Event processes have been most frequently created, based on the number of processes. You can switch to viewing based on "Item Count" using the filter located at the bottom of the graph.
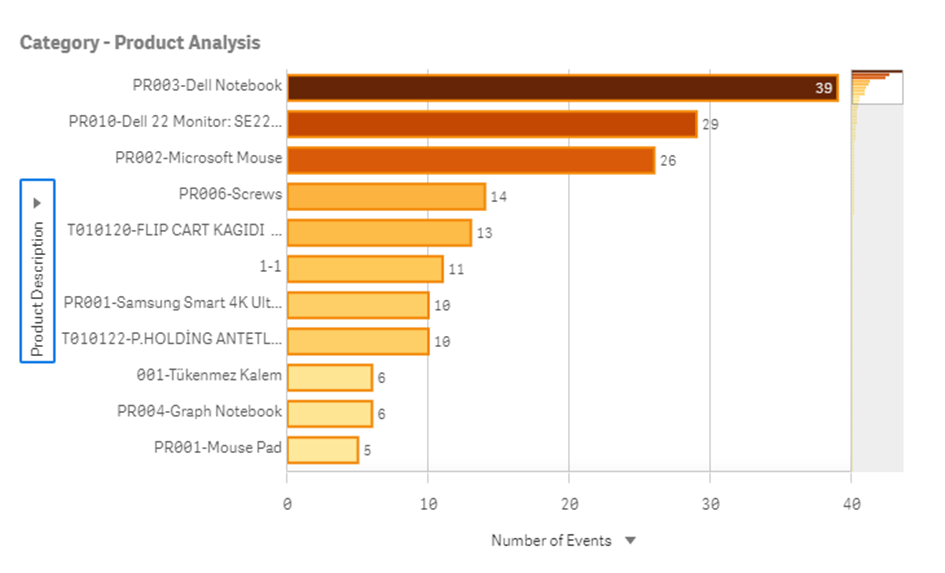
Product Analysis: This area defaults to showing the top products where Event processes have been most frequently created, based on the number of processes. To filter by product description, select "Product Description" from the filters on the left side of the graph. You can switch to viewing based on "Number of Events " using the filter located at the bottom of the graph.
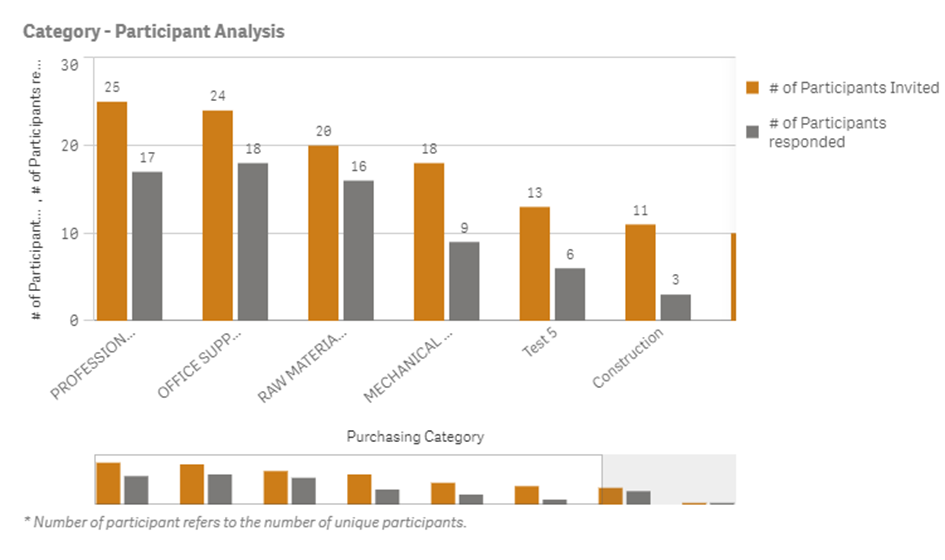
Category - Participant Analysis: Shows how many suppliers were invited and their participation counts in Event processes for the top 10 purchase categories.
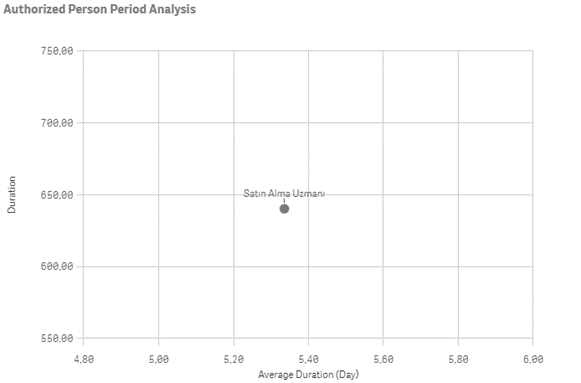
Authorized Person Time Analysis: Shows the total number of Events created by each Authorized Person, the total completion time of Events in days, and the average completion time of Events per day.
The horizontal intersecting red line on the graph represents the average completion time per day for all Events under the buyer's authority. The vertical intersecting red line shows the average number of Events created by all authorized persons under the buyer's authority.
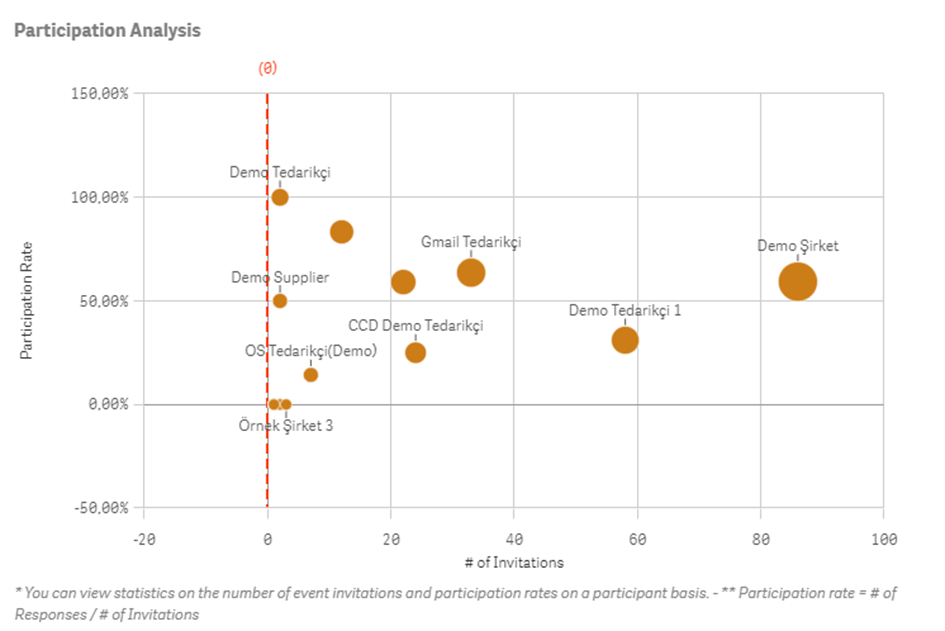
Participant Analysis:Shows the total number of invitations to Events for participating suppliers and the participation rate of invited suppliers in the processes.
The vertical intersecting red line on the graph indicates the average number of suppliers invited per Event by the buyer company officials. The horizontal intersecting red line shows the average participation rate of suppliers in Events initiated by the buyer company.
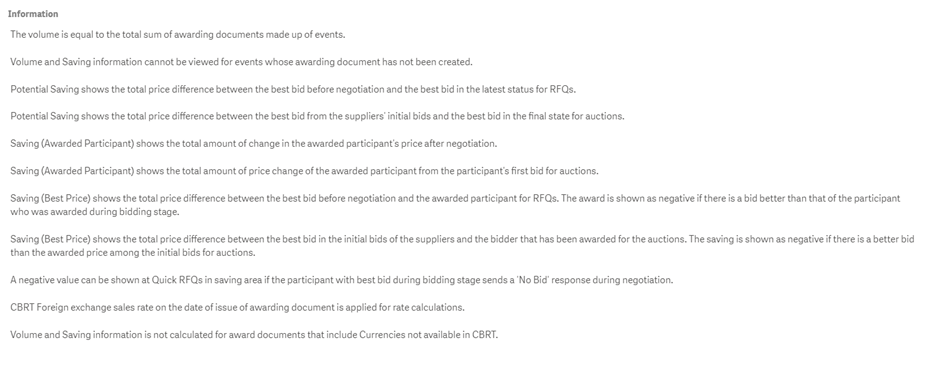
Information Page
This is the informational page where important details related to the Event Report are shared.
