Project Report
From this area, detailed reporting on the projects created in the system can be accessed.
To reach the Project Report, you should click on the "Project Report" menu under the "Reporting" heading on the left side of the screen.
On the opened page, graphical data related to all project processes belonging to the recipient can be viewed. All data in the report is updated every 24 hours.
Filters located in the upper part of the screen allow searching based on Report Currency, Year, Month, Status, Responsible Person, and Organizational Unit information. Graphs are automatically updated according to the selected filters.
The currency information in the reports automatically defaults to the company's base currency. To change the report currency, click on the "Selections" heading located in the top right corner of the screen, and update the currency there.
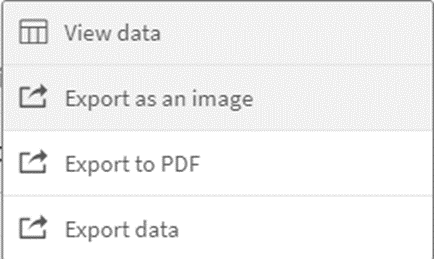
When you right-click on any graph, the following options are available in the menu:
View data: Accesses the raw data used to create the graphs.
Export as an image: Downloads the displayed graph as an image for visual use.
Export to PDF: Allows the graph to be downloaded in PDF format.
Export Data: Downloads either the displayed graph or the raw data as an Excel file.
Project Report Graphics
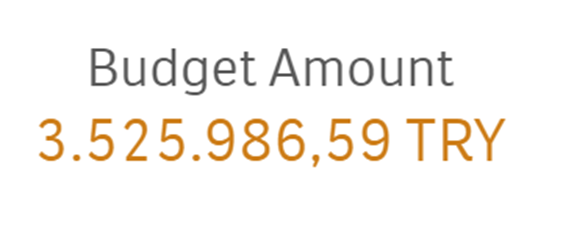
Budget Amount: Displays the total budget in the reporting currency for active projects only.
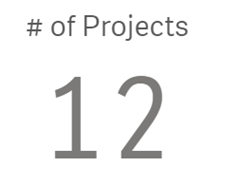
Number of Projects: Indicates the total number of projects created within the company.
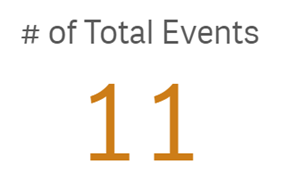
Number of Tolal Events: Represents the total number of processes within the projects.
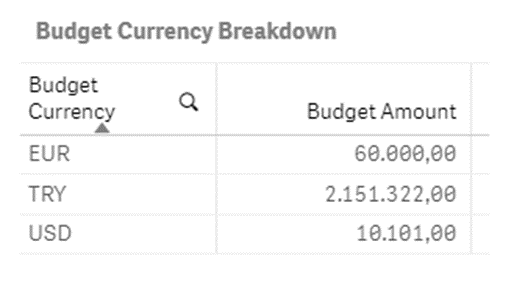
Budget Currency Breakdown: Represents the breakdown of the total budget amount shown under the Budget Amount heading, based on the currencies in which the projects were created.
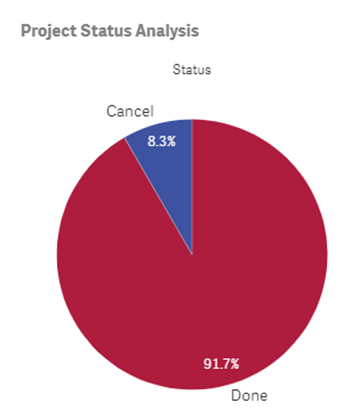
Project Status Analysis: Shows the status of all created project processes.
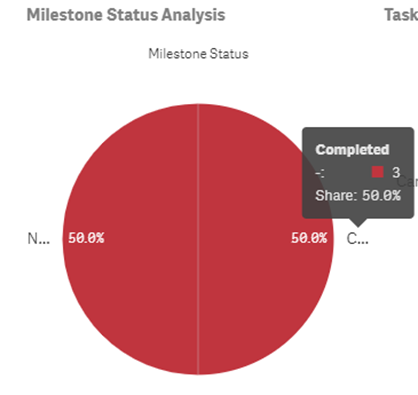
Milestone Status Analysis:Shows the status information of milestones within projects.
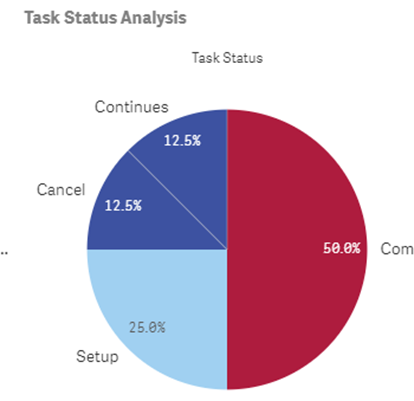
Task Status Analysis: Displays the statuses of tasks within projects.
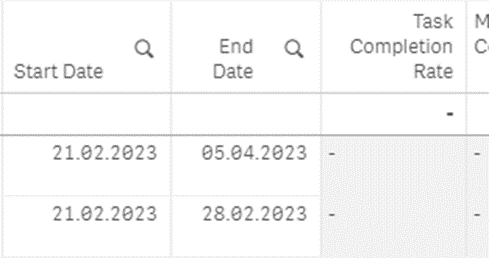
Project List:This is the area where detailed information about projects is kept in tabular form.

The completion rates of tasks and milestones for each project can be viewed in the columns located on the right side of the table.
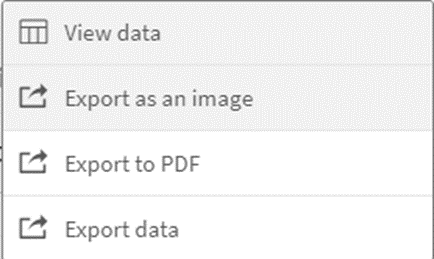
When you right-click on any graph, the following options are available in the menu:
View data: Accesses the raw data used to create the graphs.
Export as an image: Downloads the displayed graph as an image for visual use.
Export to PDF: Allows the graph to be downloaded in PDF format.
Export Data: Downloads either the displayed graph or the raw data as an Excel file.
