Event Report - Participant Analiysis
You can access other detailed reporting pages of process reports by clicking on the "Pages" button in the top right corner of the screen. Click on the "Participant Analysis" option in the dropdown window to view relevant graphs.
You can view reports related to suppliers involved in created Event processes on the opened page.
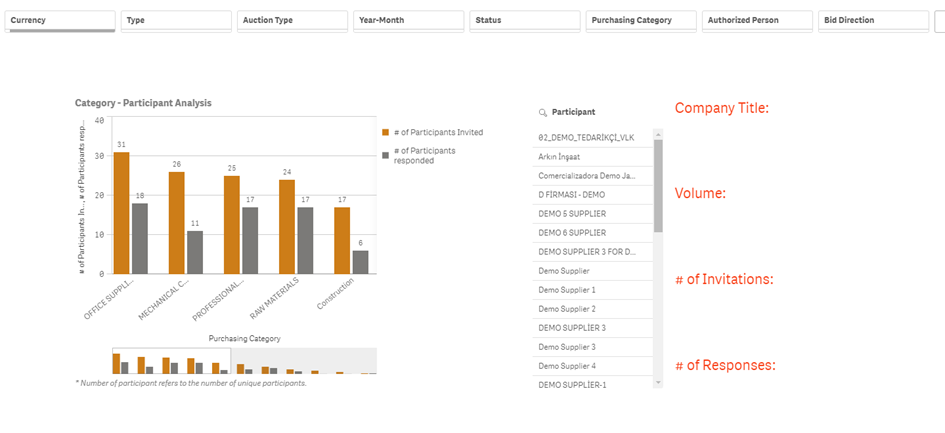
Filtering can be applied based on details such as year, month, procurement category, currency, and similar criteria from the headers at the top of the screen. Graphs are automatically updated according to the applied filters.

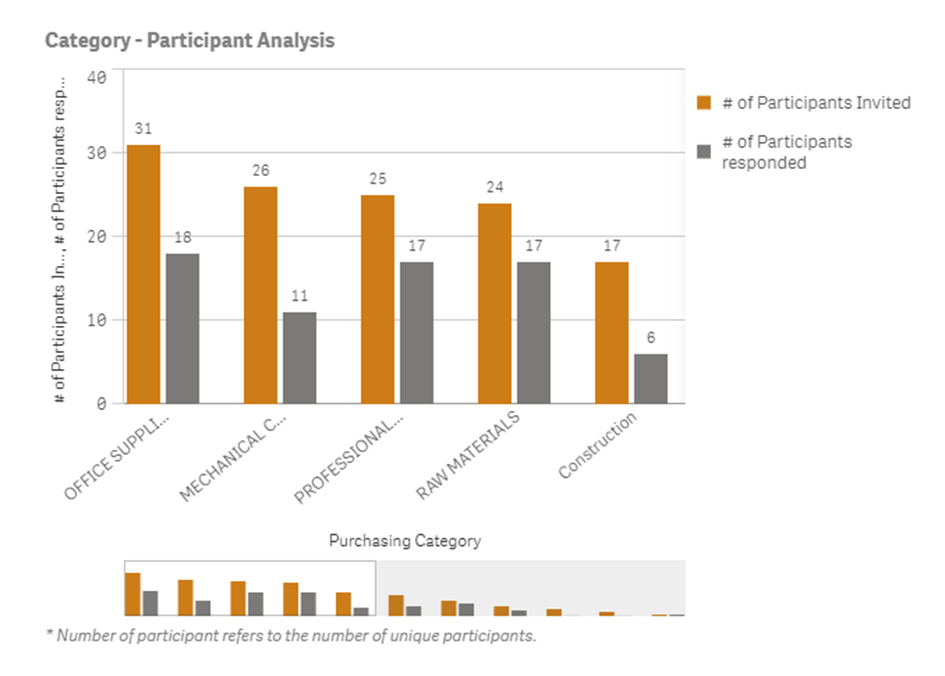
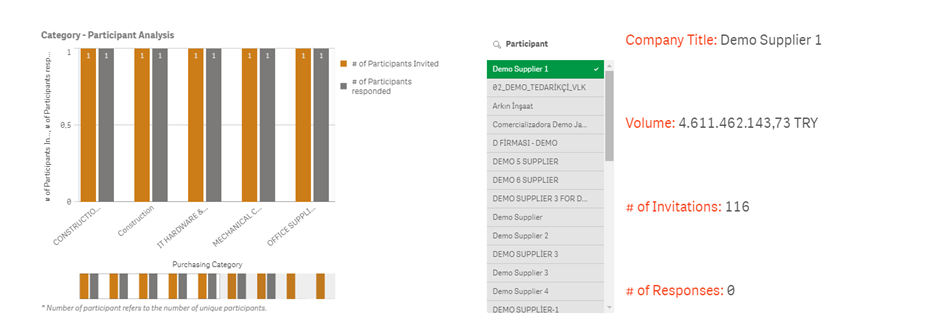
· Category - Participant Analysis:This area displays the number of invited suppliers and their participation in processes within the top procurement categories. For procurement categories beyond the top, you can scroll the graph towards the right side of the screen.
· Participant:This is the section where invited suppliers to the Event processes can be filtered. On the right side of the screen, details such as the supplier's company name, the total number of items finalized by the supplier, and the total number of processes they were invited to are displayed.
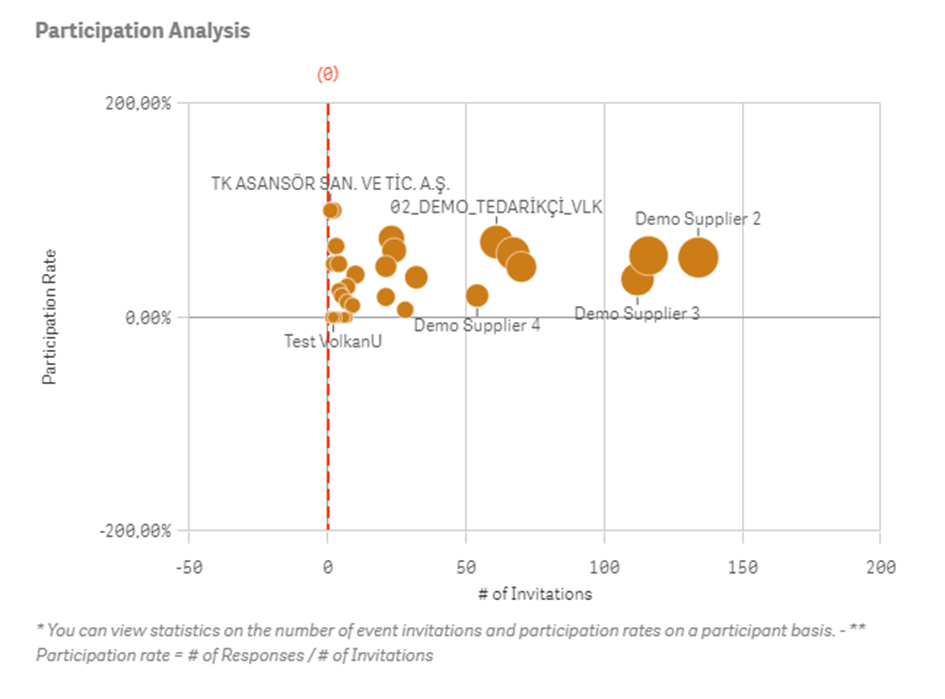
Participant Analysis: It displays the total number of invitations, total participation in processes, and the participation rate based on invited suppliers to the Events.
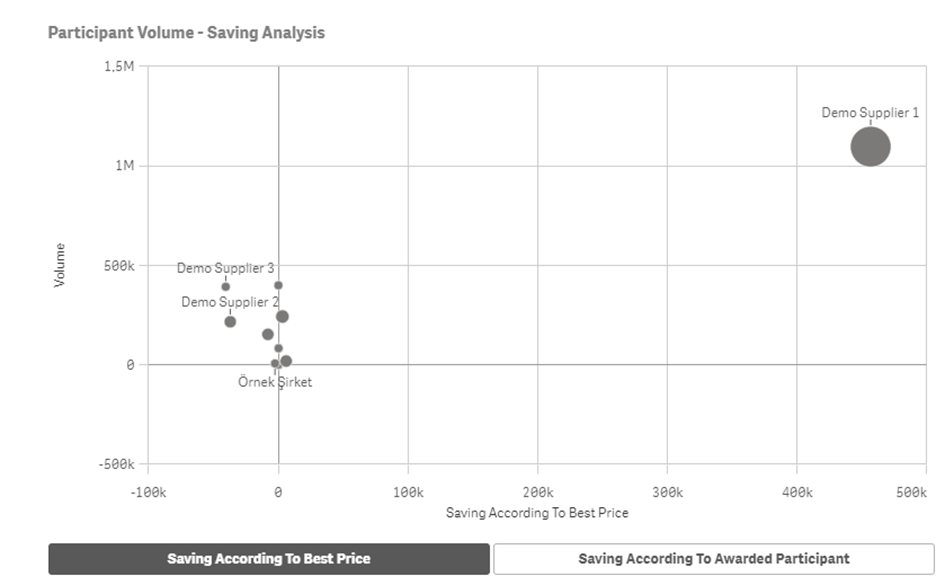
Participant Volume – Saving Analysis: It shows the total Volume and total Gain in Event items according to the suppliers who completed the process in concluded Event processes. Buttons below the table allow switching between displaying gain based on best offer or by winning participant.
