Request Report
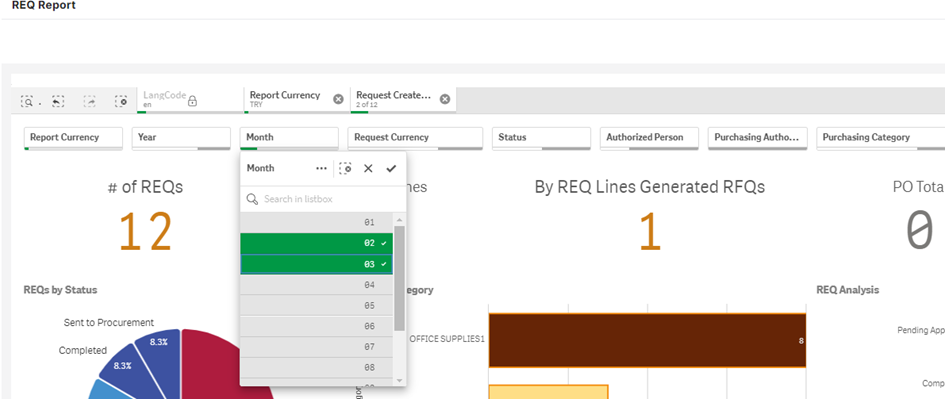
Reporting on requests made by all buyer users can be provided through the system. To access the Request Report, click on the Request Report menu under the Reporting section located on the left side of the screen.

On the opened page, graphical data related to all requests of the buyer can be displayed. All data in the report is updated every 24 hours.
Filtering can be applied based on details such as year, month, currency, and similar options located at the top section of the screen. Graphs are automatically updated according to the applied filters.
When you right-click on any graph, the following options are available in the menu:
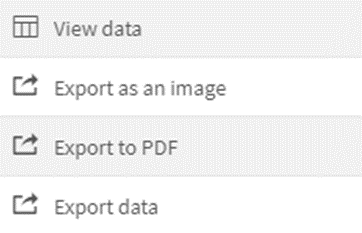
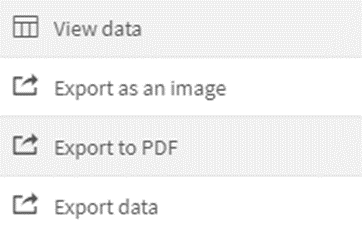
View data: Accesses the raw data used to create the graphs.
Export as an image: Downloads the displayed graph as an image for visual use.
Export to PDF: Allows the graph to be downloaded in PDF format.
Export Data: Downloads either the displayed graph or the raw data as an Excel file.
REQ Report Graphs
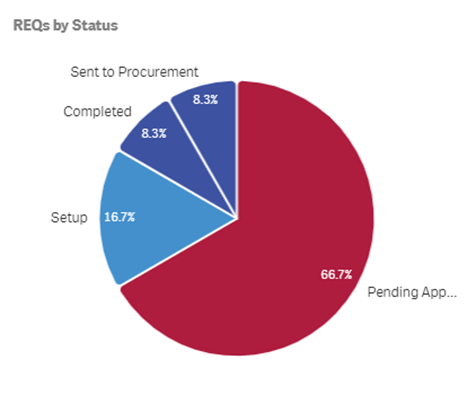
Status Analysis: Shows the distribution of all current requests based on their statuses.
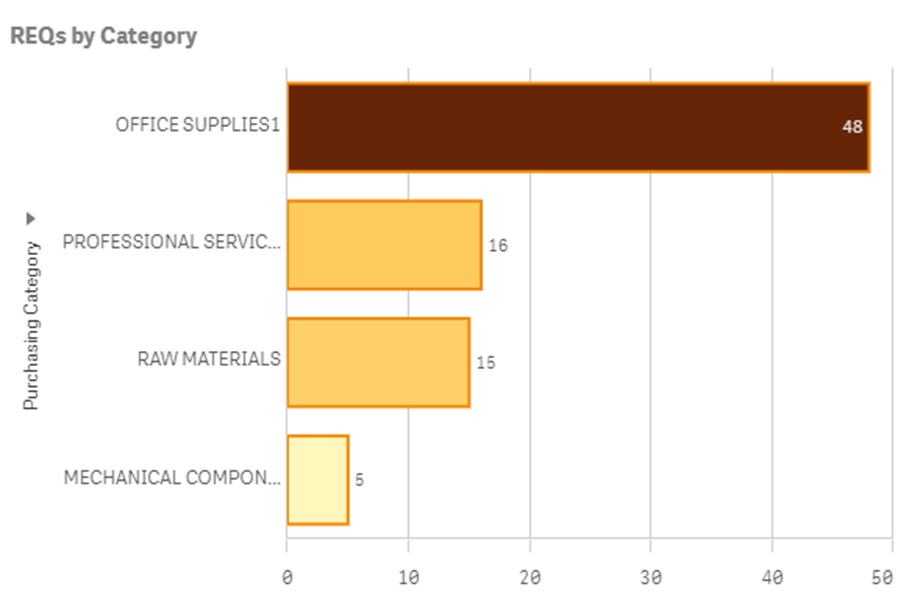
Category - Product Analysis: Category Analysis: Lists the purchasing categories where requests are most frequently generated. Clicking on data related to any category changes the filters in the remaining areas of the graph according to that specific category.
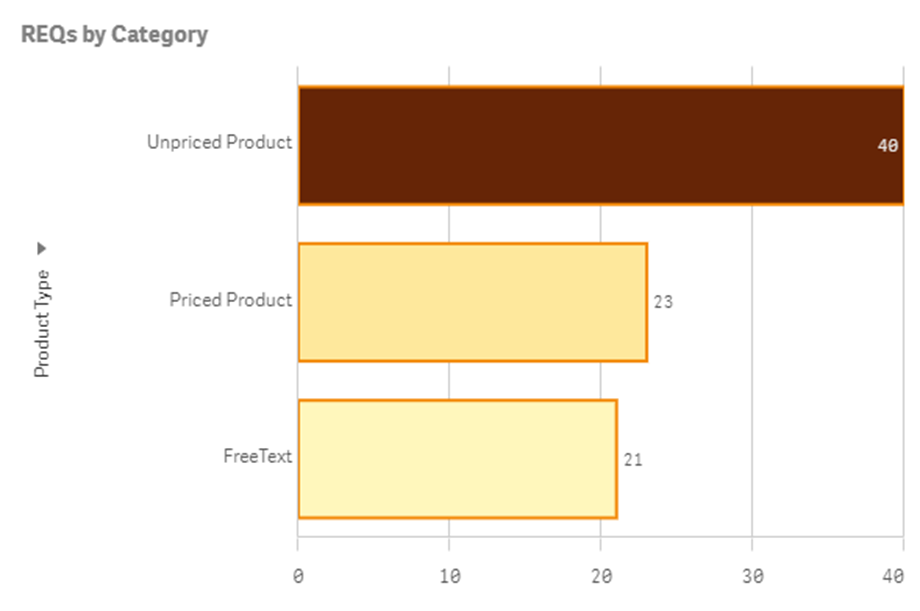
Product Type Analysis: Breaks down the product types in the opened requests into three categories: Priced Product, Free Product, or Freetext. To access product analysis, click on the optional field in the left section of the relevant graph and select the Product Type filter.
Request Processing Status: This area shows the status of the number of items in the request. It displays statistics based on actions taken regarding the items according to their status structures.
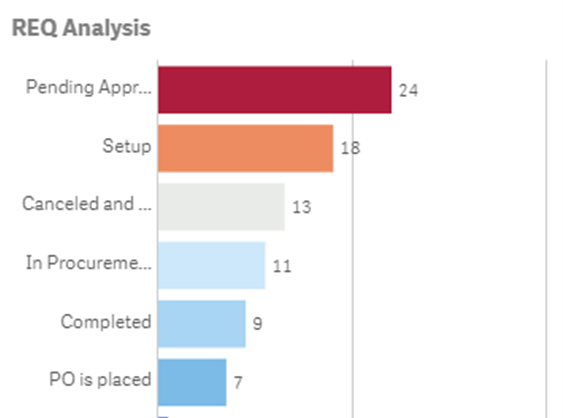
Statuses related to the graph:
· Pending Approval: Represents items in the request awaiting approval.
· Setup: Represents items pending installation.
· In Procurement: Represents items for which an order has been placed.
· Cancelled and Rejected: Represents items that have been rejected or cancelled during the approval stage.
· Completed: Represents items where the request status is completed and no RFQ process or order has been created.
· PO is placed: Represents items where an RFQ process has been initiated for the request.
Request – PO Cycle: This is the area where the turnaround times from requests to orders are reported. In the relevant graph;
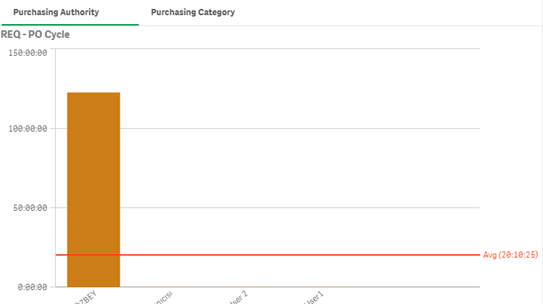
Purchasing Authority: The difference between the date when the request status is "In Procurement" and the date when the order status changes from "Installation" is calculated based on users who place orders from requests. The resulting outcome provides the average time taken per item by dividing the total time by the number of items in the request.
Purchasing Category: Click on the "Purchasing Category" text in the top right corner of the graph to access details. The calculation logic is similar to that under the "Purchasing Officer" heading, but it is presented based on purchasing categories.
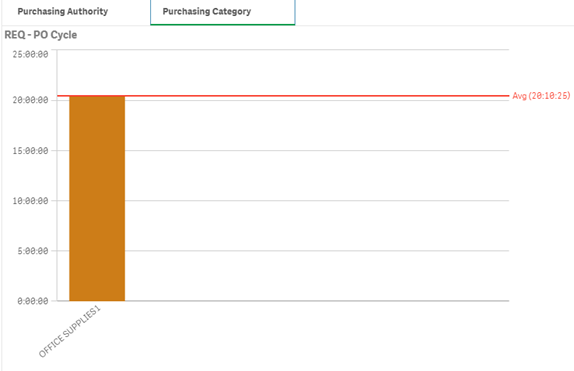
There are two different display types based on bases. The average time information for transactions can be viewed next to the red line alongside the Avg information.
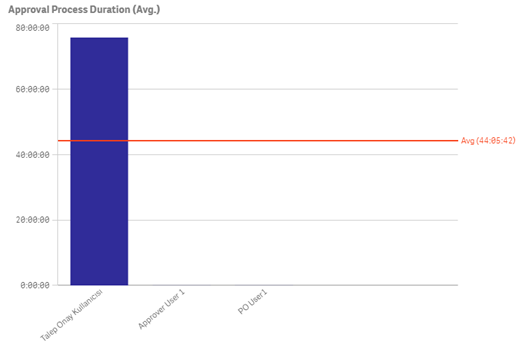
Approval Process Duration (Avg.): This area displays the average approval times of users authorized to approve requests. The time information is calculated by subtracting the date the request fell under approval from the date it was approved.
The graph shares the average time information via the red line accompanied by the Avg information within it.
REQ List
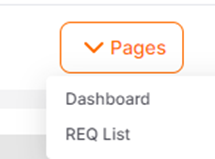
In the top right corner of the screen, you should click on the Pages button and the REQ List button.
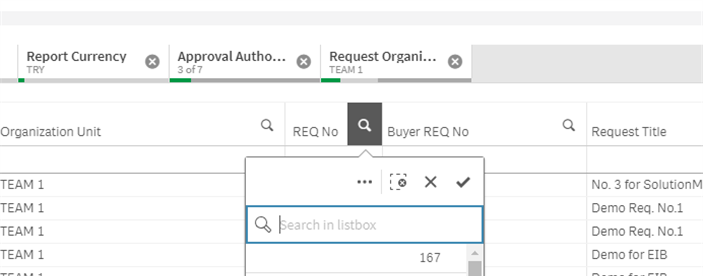
On the opened page, detailed information regarding the data saved for the requests in the system can be viewed.

To filter by any title, click on the magnifying glass icon and enter the necessary information.
When you right-click on any graph, the following options are available in the menu:
View data: Accesses the raw data used to create the graphs.
Export as an image: Downloads the displayed graph as an image for visual use.
Export to PDF: Allows the graph to be downloaded in PDF format.
Export Data: Downloads either the displayed graph or the raw data as an Excel file.
